Tuesday, August 30, 2016

VMware vCenter Server indicates that the Dynamic Resource Scheduler (DRS) usage load is imbalanced

Symptoms

  • Dynamic Resource Scheduler (DRS) usage load is not evenly balanced across hosts.
  • Some hosts within a DRS Cluster show significantly higher CPU and/or memory usage compared to other hosts in the cluster.
  • DRS resource distribution charts indicate that load is not distributed evenly across the hosts in the cluster.

Cause

The DRS process may decide not to initiate migrations of virtual machines to other hosts within the cluster if the cost involved outweighs the benefit obtained. Load balancing migrations have a cost but no additional benefit, if the required resources are available to virtual machines running on the host.

Resolution

The primary goal of the DRS is to provide virtual machines within a cluster with access to the required resources. Dynamic Resource Scheduler (DRS) is not designed to evenly balance resource usage across hosts in the cluster. 

High memory or CPU utilization of an individual host is not a sufficient reason to migrate virtual machines if the host is able to provide 100% of the resources required for its running virtual machines. This cluster imbalance can be safely ignored, if there is no observed performance degradation in virtual machines.
If a host within the DRS cluster is unable to provide a virtual machine with the resources it requires, then DRS migrates the virtual machine to a host that can provide the required resources.

The vpxd process becomes unresponsive after upgrading to vCenter Server 5.5

Symptoms


  • The vpxd.exe process continually fails.
  • You are unable to log in to vCenter Server.
  • Windows Service Manager and service.msc show VMware VirtualCenter Server service as Starting.
  • In Windows Task Manager, the vpxd process continually recycles.
  • A 0 or 1 byte vpxd.dmp file is generated in the vCenter Server log directory, located at C:\ProgramData\VMware\VMware VirtualCenter\Logs.
  • In the C:\ProgramData\VMware\VMware VirtualCenter\vpxd.log file, you see entries similar to:

    <YYYY-MM-DD>T<TIME> [16900 verbose 'VpxProfiler'] [1+] [ORM] Load: vim.vm.ConfigInfo, Id: 361
    <YYYY-MM-DD>T<TIME> [16900 verbose 'VpxProfiler'] [2+] [BulkLoadDbContent]
    <YYYY-MM-DD>T<TIME> [09124 trivia 'MoLock' opID=SWI-ba59244] Waiting on vm-361 (mode: EXCLUSIVE)
    <YYYY-MM-DD>T<TIME>[06624 warning 'utilvpxdDbLoad'] [ORM] Load: Missing mapping for property hardware.device.backing.backingObjectId 
    <YYYY-MM-DD>T<TIME> [06624 warning 'utilvpxdDbLoad'] [ORM] Load: Missing mapping for property hardware.device.backing.backingObjectId 
    <YYYY-MM-DD>T<TIME> [06624 info 'Default'] CoreDump: Writing minidump

    Note: The preceding log excerpts are only examples. Date, time, and environmental variables may vary depending on your environment. 

Purpose

Vpxd process being unresponsive after upgrading to vCenter Server 5.5 is a known issue affecting vCenter Server 5.5.

Cause

This issue occurs due to the thread stack size changing in vCenter Server 5.5.  When the VMware VirtualCenter Server service performs a validation on its Inventory data, there may be excessive snapshots that over running the smaller stack.

Resolution


This is a known issue affecting VMware vCenter Server 5.5. 

Currently, there is no resolution.

An alarm can be created to alert if virtual machines in the environment are running on a snapshot. For more information, see Configuring VMware vCenter Server to send alarms when virtual machines are running from snapshots (1018029).

To work around this issue, increase the threadstack size in the vpxd.cfg file:
  1. Stop the vCenter Server service. For more information, see Stopping, starting, or restarting vCenter Server services (1003895).
  2. From the vCenter Server, navigate to C:\ProgramData\VMware\VMware VirtualCenter\.
  3. Open the vpxd.cfg file using a text editor.
  4. Change the number in <ThreadStackKb></ThreadStackKb> to 1024 or add <ThreadStackSizeKb>1024</ThreadStackSizeKb> under <threadPool>:

    Caution: Entries within the vpxd.cfg file are case sensitive.

    For example:

    <vmacore>
    <threadPool>
    <TaskMax>90</TaskMax>
    <ThreadNamePrefix>vpxd</ThreadNamePrefix>
    <ThreadStackSizeKb>1024</ThreadStackSizeKb>
    </threadPool>
    <ssl>
    <useCompression>true</useCompresion>
    </ssl>
    </vmacore>
  5. Save the changes and close the editor window.
  6. Start the VMware VirtualCenter Server service .
Note: In some cases, the vpxd process may fail without creating a dump file or creating a 0 byte file. If you experience this issue, try one of these options: 
  • Enable the User-Mode dumps of the application. For more information, see the Microsoft article Collecting User-Mode Dumps.
  • Use the ADPlus tool from Microsoft. For more information, see Microsoft Knowledge Base article 286350.

    Note: The preceding link were correct as of June 25, 2014. If you find a link is broken, provide feedback and a VMware employee will update the link.

Thursday, August 4, 2016

How to check number of cpu cores ,sockets, threads in a linux server


[root@linuxThrill ~]# lscpu
Architecture:          x86_64
CPU op-mode(s):        32-bit, 64-bit
Byte Order:            Little Endian
CPU(s):                96
On-line CPU(s) list:   0-95
Thread(s) per core:    2
Core(s) per socket:    12
Socket(s):             4
NUMA node(s):          4
Vendor ID:             GenuineIntel
CPU family:            6
Model:                 63
Stepping:              4
CPU MHz:               2094.895
BogoMIPS:              4189.42
Virtualization:        VT-x
L1d cache:             32K
L1i cache:             32K
L2 cache:              256K
L3 cache:              30720K
NUMA node0 CPU(s):     0-11,48-59
NUMA node1 CPU(s):     12-23,60-71
NUMA node2 CPU(s):     24-35,72-83
NUMA node3 CPU(s):     36-47,84-95
[root@dh-location-analytics1 ~]#  dmidecode -t processor | grep -i cpu
Version: Intel(R) Xeon(R) CPU E7-4830 v3 @ 2.10GHz

No of Sockets : 4
Core per socket: 12
Theards per core : 2
After enabling Hyper threads : 96.

Friday, July 29, 2016

mysql-master-slave-replication

Why is MySQL replication needed?
MySQL master slave replication is carried out by many for more reasons than one. They could be:
  • To Speed up your application: One of the biggest points of interest to have master-slave set up in MySQL is to have the ability to utilize master for the inserts, update and delete queries and slave for select queries. This will generally likely to accelerate your website without needing to swooping into optimizing all the queries or purchasing more hardware.
  • To Replicate your Database: Replication is the main innovation that can fulfill the necessities of the most requesting systems, as just replication can give moment access to information and zero information loss.
  • To enable Disaster recovery strategy: A database can get unusable because of a wide assortment of hardware or software washouts. Master slave cloning will automatically create a copy of your primary database and thus you always have latest copy of your database.
  • To keep the backup up to date: Data on the slave server is more likely to be up to date than on a periodical backup which is only performed periodically (eg: daily).  If there is a complete failure of the Master Server, the Slave Server can be made available to take over the functionality, or it can be used to restore data with minimal loss.
What is MySQL master slave replication?
MySQL master slave replication is a configuration made with two MySQL database servers which allows them to easily maintain multiple copies of MySQL data. I have described in the below step wise tutorial on how to set up MySQL master-master replication. This configuration let’s slave database to automatically copy the data from master MySQL database.
What are the advantages of MySQL master slave replication?
This kind of configuration is done for many reasons as it has many advantages including,
  • Automatic database backup ,
  • A way to analyze the database without using the main database,
  • Automatically maintaining clone of the server.
Architecture of the Master Slave configuration:
On Master,
  1. Get the Replication Master Binary Log Coordinates
  2. Create a data snapshot using mysqldump
  3. Transfer the data on Slave
On Slave,
  1. Restore the data snapshot
  2. Set the Slave to start replication
Watch out this space soon to find the step wise process to do the set up for master slave replication.

Tuesday, July 26, 2016

FC port statistics for FlexFabric modules

This screen provides details on Port Information and Port Statistics, and is available only on physical uplink
ports. Detailed statistics are not supported on FC interconnect modules. However, FC-capable ports do support detailed statistics.
To reset the statistics, click Reset Statistics


CLI command Guide

Example:

# show statistics enc10:1:d2

Enc0==Enclosure number
1=IC-Bay1 VC Module
 D2 =downlink port of the VC to cross pond to Device bay 2 (Server port)

#show statistics enc10:1:X1
Enc0==Enclosure number
1=IC-Bay1 VC Module
X1=Uplink port


#reset statistics enc0:1:d2

Saturday, July 23, 2016

Oracle: Tablespace critical threshold message


A DBA's main responsibility also include checking the tablespace space regularly,We can check this space each time with help of some useful views like dba_data_files provided by oracle.But this is tough some time whenever some developer load the data and suddenly you see the space almost occupied.So I decided to use the below script which will send me the alert mail whenever the space becomes 85% filled(critical threshold) which will be very much helpful to make sure the tablespace is having enough space. 

The script is as given below: 

Tablespace critical message when it becomes 85% occupied:
----------------------------------------------------------
 

#!/bin/ksh 

export PATH=/star/app/oracle/product/11.1.0/db_1/bin:/usr/sbin:/usr/kerberos/bin:/usr/local/bin:/bin:/usr/bin:/home/star/bin 
export ORACLE_BASE=/star/app/oracle 
export LD_LIBRARY_PATH=/star/app/oracle/product/11.1.0/db_1/lib:/lib:/usr/lib 
export LD_LIBRARY_PATH=/ora11g/app/oracle/product/11.1.0.7/lib:/usr/lib:/usr/ccs/bin:/usr/dt/lib 
export ORACLE_HOME=/star/app/oracle/product/11.1.0/db_1 


MAILLIST=`cat /home/star/scripts/email.lst` 
LOGFILE=/tmp/chk_ts_$1.log 

echo $1 

CHKUP=`ps -ef | grep pmon | grep $1 | wc -l` 

if [ "${CHKUP}" -eq 1 ] 
then 
echo "The Pmon Process is running on host" 
else 
echo " ****************************************************************" >> $LOGFILE 
echo " " `date` " Pmon Proces is not found" >> $LOGFILE 
echo " ****************************************************************" >> $LOGFILE 
exit 0 
fi 

export ORACLE_SID=$1 

sqlplus -s "/ as sysdba" <WHENEVER SQLERROR EXIT SQL.SQLCODE
set echo off
set trimspool on
set trimout on
set verify off
set feedback off
column TABLESPACE_NAME format a18
column "%ocup" format a6
set lines 200
spool /tmp/chk_ts_$1.spl
SELECT total.tablespace_name tablespace_name,
ROUND (tot / 1024 / 1024) total,
ROUND ((tot - tot_l) / 1024 / 1024) occupied,
ROUND (tot_l / 1024 / 1024) remain,
ROUND (max_l / 1024 / 1024) max_extent,
ROUND ((tot - tot_l) * 100 / tot) || '%' AS "%ocup"
FROM (SELECT tablespace_name, SUM (BYTES) tot_l, MAX (BYTES) max_l
FROM dba_free_space
GROUP BY tablespace_name
UNION
SELECT d.tablespace_name,
f.bytes_free + f.bytes_used - NVL (p.bytes_used, 0) tot_l,
0 max_l
FROM SYS.v_\$temp_space_header f,
dba_temp_files d,
SYS.v_\$temp_extent_pool p
WHERE f.tablespace_name(+) = d.tablespace_name AND f.file_id(+) = d.file_id
AND p.file_id(+) = d.file_id) libre,
(SELECT tablespace_name, SUM (BYTES) tot
FROM dba_data_files
GROUP BY tablespace_name
UNION
(SELECT tablespace_name, SUM (BYTES) tot
FROM dba_temp_files
GROUP BY tablespace_name)) total,
dba_tablespaces dba_t
WHERE total.tablespace_name = libre.tablespace_name(+)
AND total.tablespace_name = dba_t.tablespace_name
AND ROUND (tot_l / 1024 / 1024) < 1024
AND ROUND ((tot - tot_l) * 100 / tot) > 85
AND dba_t.tablespace_name NOT IN ('RBS')
ORDER BY ROUND ((tot - tot_l) * 100 / tot) DESC;
spo off
EOF
if [ -s /tmp/chk_ts_$1.spl ]; then
cat /tmp/chk_ts_$1.spl | mailx -s "Critical : ($1 on machinename.abcd.com.sg) Missing free space on tablespace of the database $1 -- Immediate Action" $MAILLIST
echo "---------------------------------------------------------------------------" >> $LOGFILE
echo `date` >> $LOGFILE
cat /tmp/chk_ts_$1.spl >> $LOGFILE
echo "---------------------------------------------------------------------------" >> $LOGFILE
rm -fr /tmp/chk_ts_$1.spl
fi 

Friday, July 22, 2016

How To Fix – NFS Cluster Resource / 14202 Error in Windows Failover Cluster Manager

 The below short article wrote help to fix the 14202 errors in windows failover cluster – Titled “How-To Fix windows Failover cluster 14202 Event ID error”. Issue deals fixing One of the Cluster resources failed to start with this error in FCM (Failover Cluster Manager). It can be NFS / someother fileshare/disk based resource hosted on FCM.
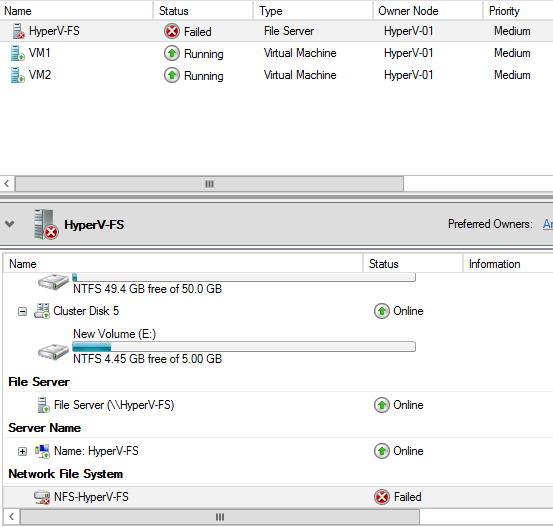
Cluster Resource Failure
Upon looking at the Resources of this Failed Cluster resource, you can see that NFS/resource related to this is in failed state.
Resource Failed -1
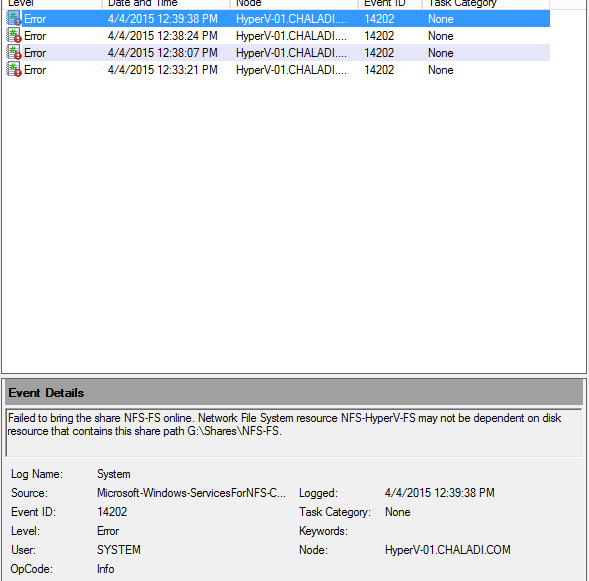
To see what’s causing the issue with NFS/related resource failures, you have to go to Cluster events to know more about the error cause.
Cluster Error Logs_Events
Now you see that NFS-HyperV-FS is not dependent on disk resource G:\shares\NFS-FS, so it is failing to get the cluster resource online as there is no dependencies for the NFS share we’ve configured to use for this NFS cluster resource. NFS file share works when it has dependencies/resources allocated to it.
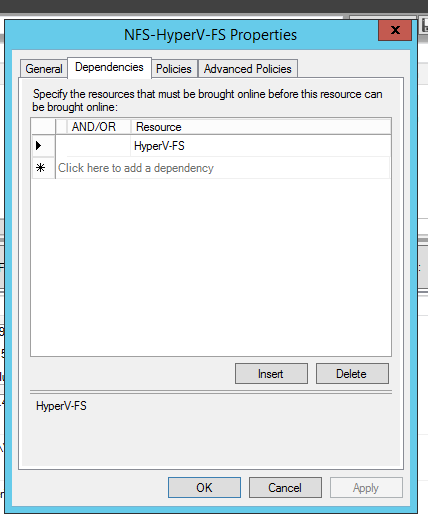
Go to NFS resource properties as below and create dependency on the drive/share as below:
Cluster Dependency missing

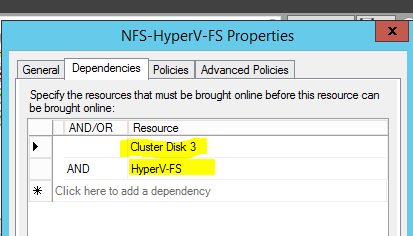
Now, click on Empty Resource field and drop down the menu there to select Cluster Disk/Disk presented to the NFS/Cluster resource in FCM (if there is only one filed here in Resource, Add One as required; click Insert to add empty fields). In my case Cluster Disk 3 is the one that is hosting the NFS shares. Click AND property to have the resource dependent on Disk explicitly; this means disk and NFS object name should be online to get the resource working (of course, if CNO (Cluster Name Object) alone is online, no use as share drive is offline:) )
Cluster dependency set
So now we’ve set the Cluster DIsk 3/NFS share disk and HyperV-FS; that is computer object name for accessing the NFS. This should solve the dependency problem and help get the cluster resource online. Now try bringing the NFS resource online again from FCM and this should work now:)
Fixed NFS cluster
Please let me know if you have any questions/trouble fixing this kind of errors. You can always comment if you have issues with Failover Clusters in Windows or VMware.\
Reference : https://chaladi.me/2015/07/29/how-to-fix-nfs-cluster-resource-14202-error-in-windows-failover-cluster-manager/

Thursday, July 21, 2016

What is hostd and vpxa in vmware ?

hostd is an app that runs in the Service Console that is responsible for managing most of the operations on the ESX machine.  It knows about all the VMs that are registered on that host, the luns/vmfs volumes visible by the host, what the VMs are doing, etc.  Most all commands or operations come down from VC through it.  i.e, powering on a VM, VM vMotion, VM creation, etc.
vpxa also runs on the Service Console and talks to VC.  I believe it acts as an intermediary between VC and hostd. I think it also does some housekeeping on the ESX host, but not as much as hostd.
VPXA
It acts as an intermediary between VC and hostd. The vCenter Server Agent, also referred to as vpxa or the vmware-vpxa service, is what allows a vCenter Server to connect to a ESX host. Specifically, vpxa is the communication conduit to the hostd, which in turn communicates to the ESX kernel.
Restart the vpxa service
/etc/init.d/vpxa restart
 
Note:- If you have SSH enabled on your ESXi server these services can also be restarted and even if these are restarted by you then also your SSH session will not be impacted.
VPXD-It is Vcenter Server Service. If this service is stopped then we will not able to connect to Vcenter Server via Vsphere client.
VPXA-It is the agent of Vcenter server. also known as mini vcenter server which is installed on the each esx server which is managed by Vcenter server. What are the management action we are performing on top of the vcenter server. (Like:- Increasing/Decreasing RAM & HDD, Making any type of changes in cluster, doing vmotion. This agent collects all information from the vcenter server and pass this information to the kernal of the esx server.
HOSTD- This is the agent of ESX server, here VPXA pass the information to the HOSTD and hostd pass the information to ESX server.
In ESX, you have only hostd and (if you have vCenter) vpxa.
These are daemon (services) for remote management:
  • hostd is used to remote management using VIC
  • vpxa is used by vCenter (the vpxd part of vCenter) to remote manament
hostd is the daemon for direct VIC connection (when you use Virtual Infra Client (VIC) to connect to your ESX).
Also,
  • vpxa is the VC agent (ESX side)
  • vpxd is the VC daemon (VC side)

Tuesday, July 19, 2016

How to reclaim Space from Datastore ?


In order to reclaim space you need to run unmap command from Vmware server.

Kindly run refer below.

esxcli storage vmfs unmap -l (label name)
or
esxcli storage vmfs unmap -u (UUID)

Thursday, July 14, 2016

HP 3PAR CLI commands


show* -  Show information about resources.

In each case type "help <command>" for detailed help.

        showalert        - show status of system alerts
        showaocfg        - show all Adaptive Optimization configurations
        showauthparam    - show authentication parameters
        showbattery      - show battery status information
        showblock        - show block mapping info for vvs, lds, pds
        showcage         - show disk cage information
        showcert         - show SSL certificate
        showcim          - show the CIM server information
        showclienv       - show CLI environment parameters
        showcpg          - show Common Provisioning Groups (CPGs)
        showdate         - show date and time on all system nodes
        showdomain       - show domains in the system
        showdomainset    - show sets of domains in the system
        showeeprom       - show node eeprom information
        showencryption   - show encryption information
showeventlog     - show event logs
showfirmwaredb   - show current database of firmware levels
showfs           - show information on File Persona cluster
showfsav         - show antivirus properties for file persona
showfsgroup      - show local group information associated with
                  File Persona
showfshare       - show file shares information
        showfsip         - show the network config of a Virtual File Server
        showfsnap        - show file store snapshots
        showfsnapclean   - show details of an on-demand snapshot reclamation task
        showfsndmp       - show details of NDMP properties of a file persona
        showfpg          - show file provisioning groups
        showfsquota      - show filesystem quota information
        showfstore       - show file store information
        showfsuser       - show local user information associated with
                           File Persona
showhost         - show host and host path information
showhostset      - show sets of hosts in the system
        showinventory    - show hardware inventory
        showiscsisession - show iscsi sessions
        showld           - show logical disks (LDs) in the system
        showldch         - show LD to PD chunklet mapping
        showldmap        - show LD to VV mapping
        showlicense      - show installed license key
        shownet          - show network configuration and status
        shownode         - show node and its component information
        shownodeenv      - show node environmental status (voltages,
                           temperatures)
        showpatch        - show what patches have been applied to the system
        showpd           - show physical disks (PDs) in the system
        showpdata        - show preserved data status
        showpdch         - show status of selected chunklets of physical disks
        showpdvv         - show PD to VV mapping
        showport         - show Fibre Channel and iSCSI ports in the system
        showportarp      - show ARP table for ports
        showportdev      - show detailed information about devices on a port
        showportisns     - show iSNS host information for ports
        showportlesb     - show Link Error Status Block information about
                           devices on Fibre Channel port
        showportpel      - show Phy Error Log information about
                           devices on SAS port
        showqos          - show QoS rules in the system
        showrcopy        - show Remote Copy configuration information
        showrctransport  - show information about end-to-end transport for
                           Remote Copy
        showrole         - show information about roles in the system
        showrsv          - show information about reservation and registration
                           of VLUNs connected on a Fibre Channel port
        showsched        - show scheduled tasks in the system
showsnmpmgr      - show SNMP trap managers
showsnmppw       - shows SNMP access passwords
showsnmpuser     - show SNMPv3 users and their authentication and
                           privacy protocols
        showspace        - show estimated free space
        showspare        - show information about spare and relocated chunklets
        showsr           - show System Reporter status
        showsralertcrit  - show System Reporter alert criteria
        showsshbanner    - show the SSH banner
        showsshkey       - show ssh public keys authorized by the current user
        showsys          - show system information (system name, serial number etc.)
        showsysmgr       - show system manager startup state
        showtarget       - show unrecognized targets
        showtask         - show information about tasks
showtemplate     - show templates
showtoc          - show system Table of Contents (TOC) summary
showtocgen       - show system Table of Contents (TOC) generation number
showuser         - show user accounts and SSH keys
showuseracl      - show user access control list
showuserconn     - show user connections
showversion      - show software versions
showvfs          - show Virtual File Server information
showvlun         - show virtual LUNs (VLUNs) in the system
showvv         - show virtual volumes (VVs) in the system
        showvvcpg        - show VV space distribution among CPGs
showvvmap        - show VV to LD mapping
showvvpd         - show VV distribution across PDs
showvvset        - show sets of VVs in the system
showwsapi        - show the Web Services API server information
showwsapisession - show the Web Services API server sessions information
showvasa         - show properties of the VASA web service provider
showvvolvm       - show information about virtual machines (vVol-based)
                           in the system

Use setclienv command to change the table format options.

Sunday, July 3, 2016

Howto Shrink a Thin Provisioned Virtual Disk (VMDK)


Shrink VMDK File

  1. Power off the Virtual Machine, or disconnect the virtual Disk you want to shrink
  2. Connect to the ESXi Host with SSH
  3. Navigate to the Virtual Machine Folder
  4. Verify disk usage with du
  5. Run vmkfstools -K [disk]
  6. Verify disk usage with du
root@esx3:/vmfs/volumes/ds1/vma $ du -h vma_1-flat.vmdk
7.9G vma_1-flat.vmdk

root@esx3:/vmfs/volumes/ds1/vma $ vmkfstools -K vma_1.vmdk
vmfsDisk: 1, rdmDisk: 0, blockSize: 1048576
Hole Punching: 25% done.

root@esx3:/vmfs/volumes/ds1/vma $ du -h vma_1-flat.vmdk
1.9G vma_1-flat.vmdk

Saturday, June 4, 2016

How to find the particular Data Dictionary Table or Dynamic Performance View (V$)?


Even though we use some of the important Data Dictionary Tables andDynamic Performance (V$) views regularly, sometimes we fall short to recall a particular view, i.e. It’s not easy to remember all the dictionary views.

And also, many times, it’s been asked by novice in the OTN Forums that

What is the view to find the information about data files, tablespaces, etc.,?

What are the list of Data Dictionary and Dynamic Performance Views in so and so Oracle Version?


Well, I hope all of we know that there is a data dictionary view called “DICTIONARY”, using this DICTIONARY view, we can find the particular or list of pertinent views of any object in the database.

What is the DICTIONARY view?
The DICTIONARY view is a data dictionary view used to find the list of Data Dictionary and Dynamic Performance (V$) views, and it contains description of data dictionary tables and views. It has two columns, one is ‘TABLE_NAME’ – Name of the object and another column is ‘COMMENTS’ – Text comment on the object.

Discription:
SQL> desc DICTIONARY;
Name Null? Type
--------------------- -------- --------------
TABLE_NAME VARCHAR2(30)
COMMENTS VARCHAR2(4000)

Usage: 

To find the list of data dictionary tables and dynamic performance views.

SELECT * FROM dict;

To find the particular data dictionary table or dynamic performance view.

SELECT * FROM dictionary
WHERE table_name LIKE ‘%Search String%’;


i.e.

SELECT * FROM dictionary
WHERE table_name LIKE ‘%TABLESP%’;

Example:

SQL> SELECT * FROM dictionary
WHERE table_name='DICTIONARY';

TABLE_NAME
------------------------------
COMMENTS
-----------------------------------------------
DICTIONARY
Description of data dictionary tables and views

Note: While querying, either the complete word DICTIONARY or first four characters DICT, which is a synonym for DICTIONARY, can be used.

Reference: Oracle® Database Reference 10g Release 2 (10.2) 

http://download.oracle.com/docs/cd/B19306_01/server.102/b14237/toc.htm