About open source tool “iperf”, it is a best choice for measuring TCP/UPD bandwidth performance because it allow us to change TCP/UPD parameters and report bandwidth/Jitter diagram.
Due to “iperf” is command-line, we can add a graphical frontend tool “Jperf” or “XJperf” (develop on Google Code) after the “iperf” is installed so that the operation will be easy.
Install iperf
The easy way is using the sudo apt-get install iperf command or pre-compiled binary(# 1). So do that we will install the latest version of iperf.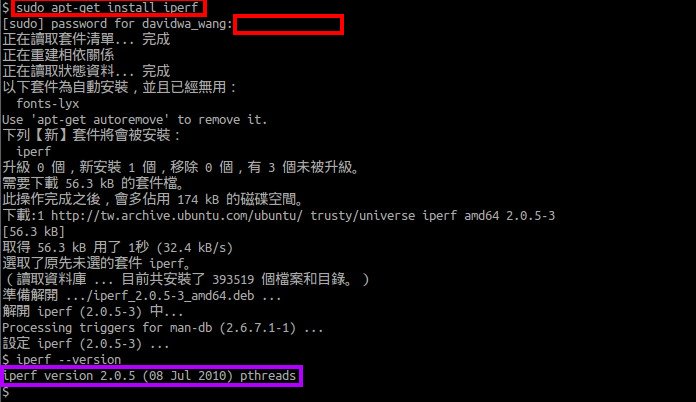
Install XJperfDue to the Jperf require the Java version 1.5 or later, we have to verify whether the Java has already been installed on OS platform. If no exist, we can download & install the latest version from java.com Website.
If it is ready, we will download the latest file jperf-2.0.2.zip from xjperf Google CodePage next to extract it to any location as /usr/local/src/ path. Then the jperf.sh script within the /usr/local/src/jperf-2.0.2/ directory have to set executable permission by running sudo chmod u+x jperf.sh or sudo chmod a+x jperf.sh command.
So do that we can directly launch the application by executing ./jperf.sh command
and the Network performance measurement graphical tool will show up.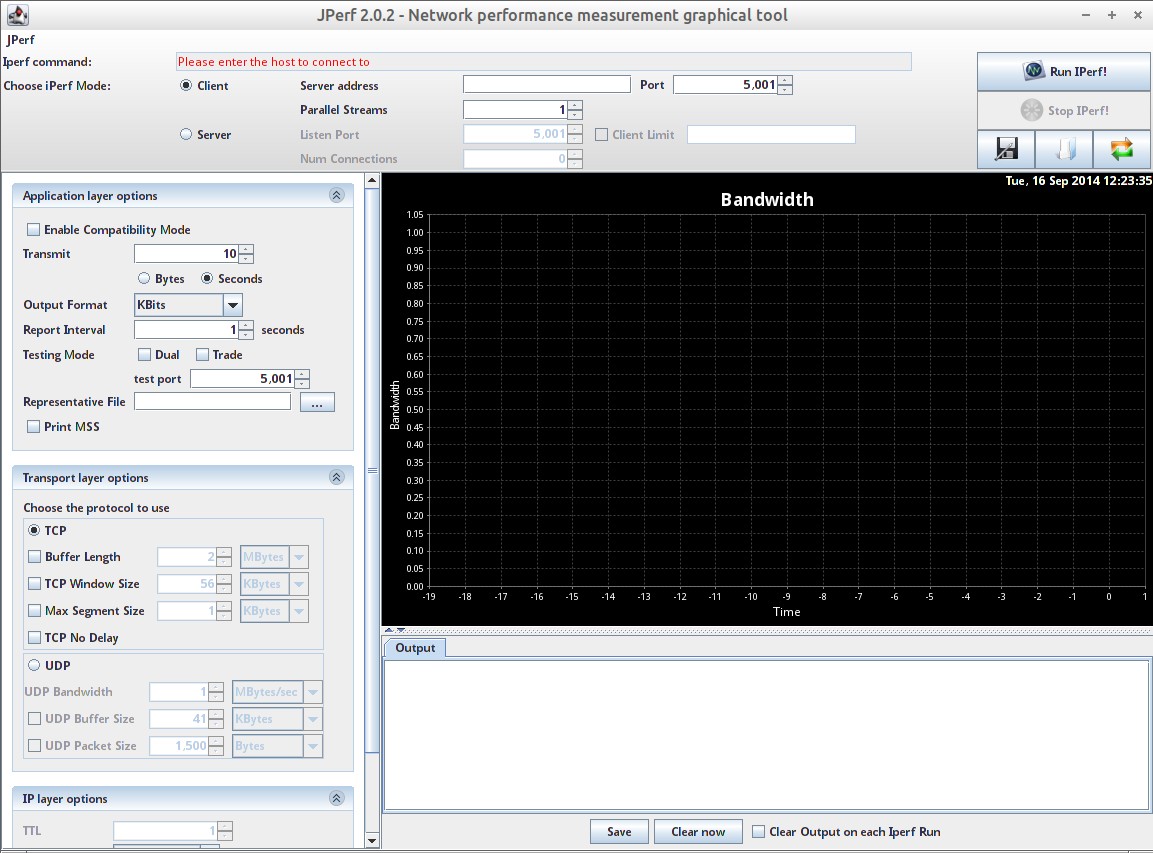
Start Jperft Server roleDue to Jperf behavior is as a client/server application, we have to firstly start a Jperf server next to run a Jperf client on the network environment.
To start the Jperf server by selecting the Server radio button clicking the Run IPerf!button if we don’t want to change any the default setting as Jperf run in TCP mode or the listening port in 5001 and so on.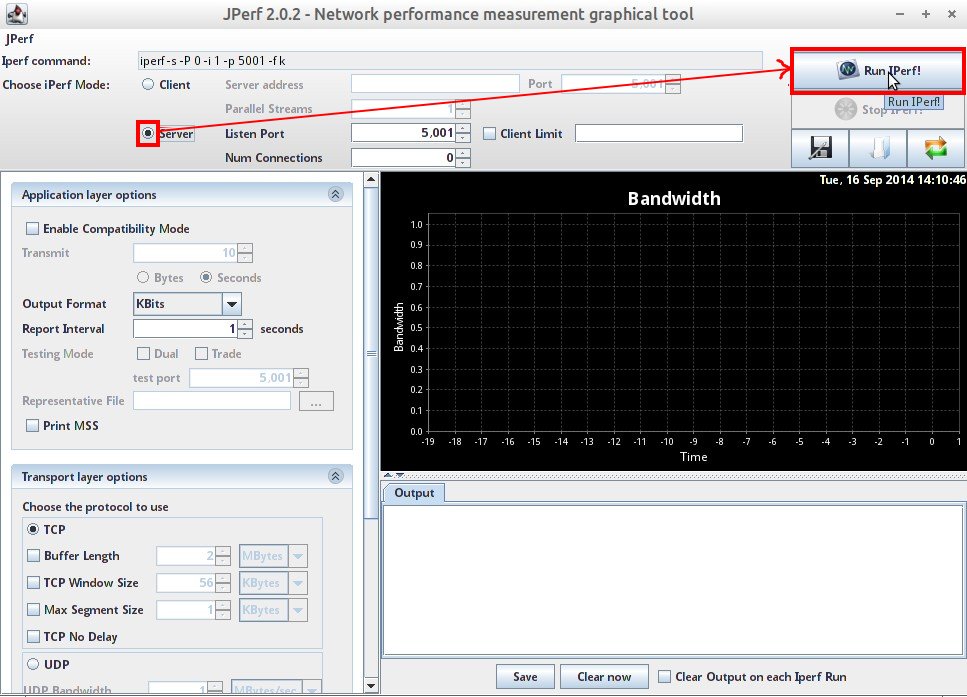
So does that the Jperf Server role will be enabled and wait for Jperf client connection.
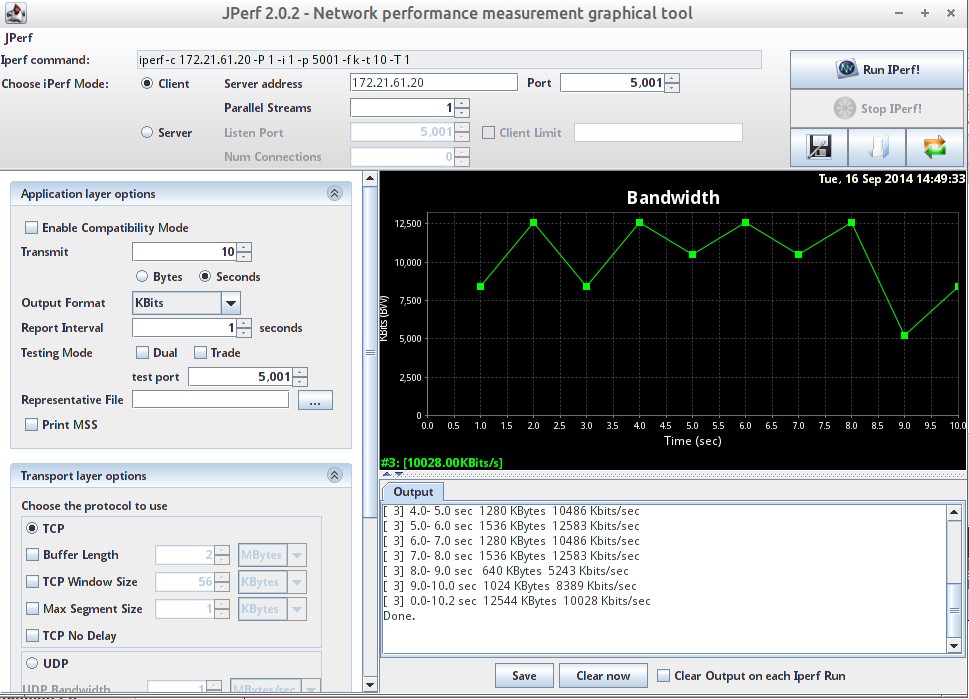
Start Jperf Client roleTo launch the Jperf application in another machine, we have to select the Client radio button next to type the IP address of the Jperf server in the server address field. If we accept the default setting as Jperf will run a 10 second TCP test by using 1 stream, please click the Run IPerf! button to begin the test mechanism.
When the iperf client send out testing data to the iperf server and the process end normally, we can see the related network report on this tool.
Jperft Server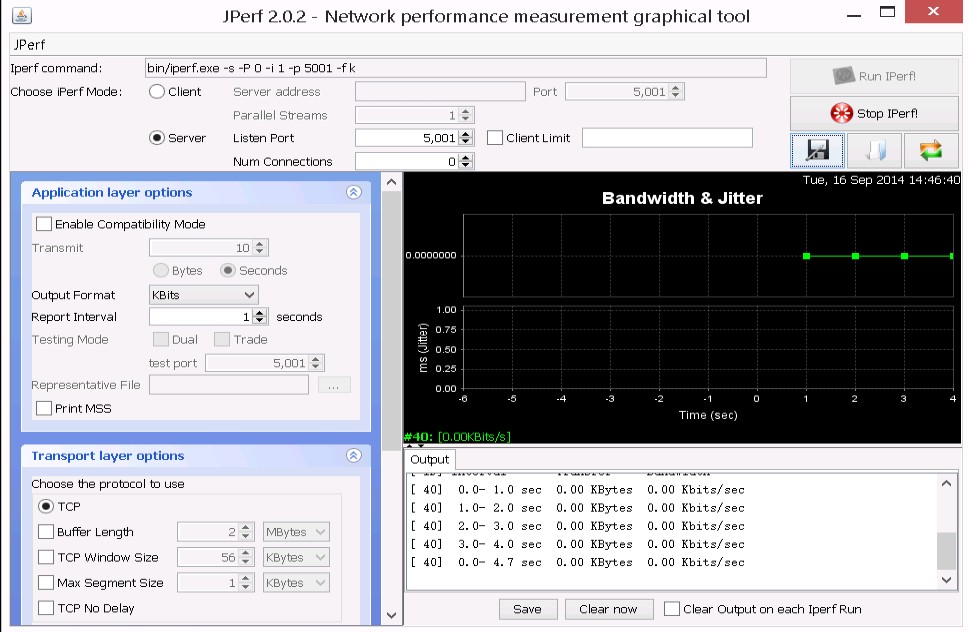 Jperft Client
Due to “iperf” is command-line, we can add a graphical frontend tool “Jperf” or “XJperf” (develop on Google Code) after the “iperf” is installed so that the operation will be easy.
Install iperf
The easy way is using the sudo apt-get install iperf command or pre-compiled binary(# 1). So do that we will install the latest version of iperf.
Install XJperfDue to the Jperf require the Java version 1.5 or later, we have to verify whether the Java has already been installed on OS platform. If no exist, we can download & install the latest version from java.com Website.
If it is ready, we will download the latest file jperf-2.0.2.zip from xjperf Google CodePage next to extract it to any location as /usr/local/src/ path. Then the jperf.sh script within the /usr/local/src/jperf-2.0.2/ directory have to set executable permission by running sudo chmod u+x jperf.sh or sudo chmod a+x jperf.sh command.
So do that we can directly launch the application by executing ./jperf.sh command
and the Network performance measurement graphical tool will show up.
Start Jperft Server roleDue to Jperf behavior is as a client/server application, we have to firstly start a Jperf server next to run a Jperf client on the network environment.
To start the Jperf server by selecting the Server radio button clicking the Run IPerf!button if we don’t want to change any the default setting as Jperf run in TCP mode or the listening port in 5001 and so on.
So does that the Jperf Server role will be enabled and wait for Jperf client connection.
Start Jperf Client roleTo launch the Jperf application in another machine, we have to select the Client radio button next to type the IP address of the Jperf server in the server address field. If we accept the default setting as Jperf will run a 10 second TCP test by using 1 stream, please click the Run IPerf! button to begin the test mechanism.
When the iperf client send out testing data to the iperf server and the process end normally, we can see the related network report on this tool.
Jperft Server
No comments:
Post a Comment