Thursday, March 31, 2016

How to Fix PHP 'zend_mm_heap corrupted' Error ?

If you see the error zend_mm_heap corrupted in the global PHP-FPM error log file at /var/log/phpX.Y-fpm-sp.log, the most likely cause of the problem is a buggy PHP extension crashing PHP.

PHP extensions include the New Relic PHP extension and any PECL extension, such as memcache, redis, and others.

Step One: Disabling Third-Party PHP Extensions

If you are seeing "zend_mm_heap corrupted" in your logs, you should disable all third-party PHP extensions until you can identify which one is causing the problem.

To disable a PHP extension, SSH into your server as root and then rename the extension's file at:

/etc/phpX.Y-sp/conf.d/EXTENSION.ini
to:

/etc/phpX.Y-sp/conf.d/EXTENSION.ini.disabled
Next, restart PHP by running this command as root:

sudo service phpX.Y-fpm-sp restart
Replace "X.Y" with the version of PHP, for example "5.6".

Step Two: Changing the PHP Version

If you have disabled all third-party PHP extensions and are still getting errors, your app's PHP code is likely triggering a bug in PHP itself and you should switch to a different PHP version.

HOW TO FIGURE OUT WHAT IS CAUSING AN APACHE SEGMENTATION FAULT

Ever seen this in your Apache error log?
1
[notice] child pid 10024 exit signal Segmentation fault (11)
If you have, read on. At my day job I deal with both Apache and PHP a lot. If you have ever tried to figure out why your PHP code seems to cause Apache segmentation faults, you probably experienced the same as I did. Lots of pain, frustration and headaches. However all is not lost. There is a way to figure out whatPHP code is making Apache act crazy. I’ll try to explain how to debug Apache using gdb to locate that nasty bug that is causing you to lose your precious beauty sleep.

BEFORE WE BEGIN

Now, Apache does not dump core by default. We need to do some work before that happens. If you don’t like to get your hands dirty compiling stuff manually, you should leave now, this is not for you.
Still here? Good! Before we start, make sure you have:
  1. Root access to your web server
  2. Apache source code and everything needed to (re-)compile Apache
  3. PHP source code (or just download the .gbdinit file)

MAKE APACHE DUMP CORE

The first step is to make Apache not change user when it starts up and forks, so we will make it run as root the whole time. To accomplish this we need to compile Apache with -DBIG_SECURITY_HOLE. For obvious reasons, this is not recommended for production.
1
2
3
make clean
export EXTRA_CFLAGS="-DBIG_SECURITY_HOLE"
./configure && make && make install
Now specify the “root” as the “User” in httpd.conf. While we’re editing httpd.conf we’ll add a setting to specify where Apache should put our core dump.
1
2
3
User nobody
[...]
CoreDumpDirectory /tmp/apache
Make sure /tmp/apache exists
1
mkdir -p /tmp/apache
On most systems the core file size is set to zero by default. We’ll go ahead and change it to unlimited.
1
ulimit -c 0
You can check your current core dump file size limit by running
1
ulimit -a
Restart Apache
1
apachectl restart
Next time Apache crashes with a Segmentation fault it should make us a core dump. If you did everything correctly you should see something like this in the apache error_log.
1
2
[notice] child pid 16430 exit signal Segmentation fault (11),  
possible coredump in /tmp/apache
Note: For reasons unclear to me my dump file ended up on the root (/) and not in the directory we specified with CoreDumpDirectory. If anyone knows why please drop me a comment.

MAKING SENSE OF THE CORE DUMP

At this point we could run gdb and get a backtrace, however that will only show us the function called inside php itself and not pinpoint where in our php code the problem is. To get a backtrace of our PHPcode we need to use the “dump_bt” function inside the .gbdinit file. Copy the .gbdinit file to your home directory
1
cp <php_source>/.gdbinit ~/
Start gdb with the path to httpd from the source as first parameter and the path to the core dump file as second
1
2
cd ~
gdb <apache_source>/src/httpd /tmp/apache/<core_file>
Run bt_dump from .gdbinit:
1
(gdb) dump_bt executor_globals.current_execute_data
Instead of a internal PHP backtrace we should get a nice backtrace of our PHP code.
 1
 2
 3
 4
 5
 6
 7
 8
 9
10
11
12
13
14
15
[...]
[0xbf75f6fc] query() /home/site/www/lib/ezdb/classes/ezmysqldb.php:767
[0xbf76249c] unlock() /home/site/www/lib/ezdb/classes/ezmysqldb.php:484
[0xbf7627bc] query() /home/site/www/lib/ezdb/classes/ezmysqldb.php:767
[0xbf76555c] unlock() /home/site/www/lib/ezdb/classes/ezmysqldb.php:484
[0xbf76587c] query() /home/site/www/lib/ezdb/classes/ezmysqldb.php:767
[0xbf76861c] unlock() /home/site/www/lib/ezdb/classes/ezmysqldb.php:484
[0xbf76893c] query() /home/site/www/lib/ezdb/classes/ezmysqldb.php:767
[0xbf76b6dc] unlock() /home/site/www/lib/ezdb/classes/ezmysqldb.php:484
[0xbf76b9fc] query() /home/site/www/lib/ezdb/classes/ezmysqldb.php:767
[0xbf76e79c] unlock() /home/site/www/lib/ezdb/classes/ezmysqldb.php:484
[0xbf76eabc] query() /home/site/www/lib/ezdb/classes/ezmysqldb.php:767
[0xbf77185c] unlock() /home/site/www/lib/ezdb/classes/ezmysqldb.php:484
[0xbf771b7c] query() /home/site/www/lib/ezdb/classes/ezmysqldb.php:767
[...]
In this example we can clearly see there is a recursive problem with query() and unlock() on line 767 and 484 in ezmysqldb.php. With the help of this backtrace in only took a quick look in ezmysqldb.php before I had a bug report written and posted: http://issues.ez.no/11038.
Thanks to my good friend and co-worker Derick Rethans for telling me about the “dump_bt” function.

Wednesday, March 30, 2016

Real-time monitoring of Hadoop clusters

we are running Hadoop clusters on different environments using Cloudbreak and apply SLA autoscaling policies on the fly, thus monitoring the cluster is a key operation.
Although various solutions have been created in the software industry for monitoring of activities taking place in a cluster, but it turned out that only a very few of them satisfies most of our needs. When we made the decision about which monitoring libraries and components to integrate in our stack we kept in mind that it needs to be:
  • scalable to be able to efficiently monitor small Hadoop clusters which are consisting of only a few nodes and also clusters which containing thousands of nodes
  • flexible to be able to provide overview about the health of the whole cluster or about the health of individual nodes or even dive deeper into the internals of Hadoop, e.g. shall be able to visualize how our autoscaling solution for Hadoop YARN called Periscope moves running applications between queues
  • extensible to be able to use the gathered and stored data by extensions written by 3rd parties, e.g. a module which processes the stored (metrics) data and does real-time anomaly detection
  • zero-configuration to be able to plug into any existing Hadoop cluster without additional configuration, component installation
Based on the requirements above our choice were the followings:
  • Logstash for log/metrics enrichment, parsing and transformation
  • Elasticsearch for data storage, indexing
  • Kibana for data visualization

High Level Architecture

In our monitoring solution one of the design goal was to provide a generic, pluggable and isolated monitoring component to existing Hadoop deployments. We also wanted to make it non-invasive and avoid adding any monitoring related dependency to our Ambari, Hadoop or other Docker images. For that reason we have packaged the monitoring client component into its own Docker image which can be launched alongside with a Hadoop running in another container or even alongside a Hadoop which is not even containerized.
In a nutshell the monitoring solution consist of client and server containers. The server contains the Elasticsearch and the Kibana module. The server container is horizontally scalable and it can be clustered trough the clustering capabilities of Elasticsearch.
The client container – which is deployed on the machine what is needed to be monitored – contains the Logstash and the collectd module. The Logstash connects to Elasticsearch cluster as client and stores the processed and transformed metrics data there.

Hadoop metrics

The metrics data what we are collecting and visualizing are provided by Hadoop metrics, which is a collection of runtime information that are exposed by all Hadoop daemons. We have configured the Metrics subsystem in that way that it writes the valuable metrics information into the filesystem.
In order to be able to access the metrics data from the monitoring client component – which is running inside a different Docker container – we used the capability of Docker Volumes which basically let’s you access a directory within one container form other container or even access directories from host systems.
For example if you would like mount the /var/log from the container named ambari-singlenode under the /amb/log in the monitoring client container then the following sequence of commands needs to be executed:
1
2
EXPOSED_LOG_DIR=$(docker inspect --format='{{index .Volumes "/var/log"}}' ambari-singlenode)
docker run -i -t -v $EXPOSED_LOG_DIR:/amb/log  sequenceiq/baywatch-client /etc/bootstrap.sh -bash
Hundreds of different metrics are gathered form Hadoop metrics subsystem and all data is transformed by Logstash to JSON and stored in ElasticSearch to make it ready for querying or displaying it with Kibana.
The screenshot below has been created from one of our sample dashboard which is displaying Hadoop metrics for a small cluster which was started on my notebook. In this cluster the Yarn’s Capacity Scheduler is used and for demonstration purposes I have created a queue called highprio alongside the default queue. I have reduced the capacity of the default queue to 30 and defined the highprio queue with a capacity of 70. The red line in the screenshot belongs to the highprio queue, the yellow line belongs to the default queue and the green line is the root queue which is the common ancestor both of them. In the benchmark, the jobs were submitted to the default queue and a bit later (somewhere around 17:48) the same jobs were submitted to the highprio queue. As it is clearly observable for highprio queue the allocated Containers, Memory and VCores were higher and jobs were finished much more faster than those that were submitted to the default queue.
Such kind of dashboard is extremely useful when we are visualizing decisions made by Periscope and check e.g. how the applications are moved across queues, or additional nodes are added or removed dynamically from the cluster.
To see it in large, please click here.
Since all of the Hadoop metrics are stored in the Elasticsearch, therefore there are a lot of possibilities to create different dashboards using that particular parameter of the cluster which is interesting for the operator. The dashboards can be configured on the fly and the metrics are displayed in real-time.

System resources

Beside Hadoop metrics, “traditional” system resource data (cpu, memory, io, network) are gathered with the aid of collectd. This can also run inside the monitoring client container since due to the resource management in Docker the containers can access and gather information about the whole system and a container can even “steal” the network of other container if you start with:--net=container:id-of-other-container which is very useful if cases when network traffic is monitored.

Summary

So far the Hadoop metrics and system resource metrics have been processed, but it is planned to use the information written into the history file (or fetch from History server) and make it also queryable trough Elasticsearch to be able to provide information about what is happening inside the jobs.

Elastic Search integration with Hadoop

Elastic  is open source distributed search engine, based on lucene framework with Rest API. You can download the elastic search using the URLhttp://www.elasticsearch.org/overview/elkdownloads/. Unzip the downloaded zip or tar file and then start one instance or node of elastic search by running the script ‘elasticsearch-1.2.1/bin/elasticsearch’ as shown below:
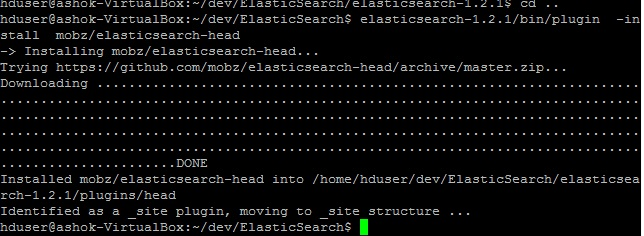
Es_start

Installing plugin:

We can install plugins for enhance feature like elasticsearch-head provide the web interface to interact with its cluster.  Use the command ‘elasticsearch-1.2.1/bin/plugin  -install  mobz/elasticsearch-head’ as shown below:
Es_plugin
And, Elastic Search web interface can be using url: http://localhost:9200/_plugin/head/
Es_plugin1

Creating the index:

(You can skip this step) In Search domain, index is like relational database. By default number of shared created is ‘5’ and replication factor “1” which can be changed on creation depending on your requirement.  We can increase the number of replication factor but not number of shards.
1
curl -XPUT "http://localhost:9200/movies/" -d '{"settings" : {"number_of_shards" : 2, "number_of_replicas" : 1}}'
Elastic Search Index figure
Create Elastic Search Index

Loading data to Elastic Search:

If we put data to the search domain it will automatically create the index.

Load data using  -XPUT

We need to specify the id (1)  as shown below:
1
curl -XPUT "http://localhost:9200/movies/movie/1" -d '{"title": "Men with Wings", "director": "William A. Wellman", "year": 1938, "genres": ["Adventure", "Drama","Drama"]}'
Note: movies->index, movie->index type, 1->id
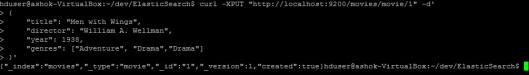
Elastic Search -XPUT

Load data using -XPOST

The id will be automatically generated as shown below:
1
curl -XPOST "http://localhost:9200/movies/movie" -d' { "title": "Lawrence of Arabia", "director": "David Lean", "year": 1962, "genres": ["Adventure", "Biography", "Drama"] }'
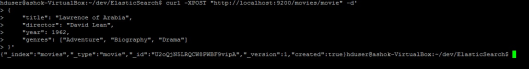
Elastic Search -XPOST
Note: _id: U2oQjN5LRQCW8PWBF9vipA is automatically generated.

The _search endpoint

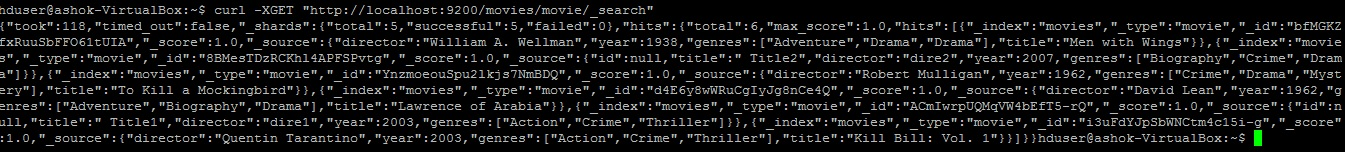
The index document can be searched using below query:
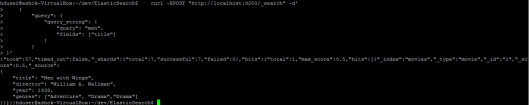
1
curl -XPOST "http://localhost:9200/_search" -d' { "query": { "query_string": { "query": "men", "fields": ["title"] } } }'
ES Search Result
ES Search Result

Integrating with Map Reduce (Hadoop 1.2.1)

To integrate Elastic Search with Map Reduce follow the below steps:

Add a dependency to pom.xml:

1
2
3
4
5
6
7
8
9
<dependency>
 
<groupId>org.elasticsearch</groupId>
 
<artifactId>elasticsearch-hadoop</artifactId>
 
<version>2.0.0</version>
 
</dependency>
or Download and add elasticSearch-hadoop.jar file to classpath.

Elastic Search as source & HDFS as sink:

In Map Reduce job, you specify the index/index type of search engine from where you need to fetch data in hdfs file system. And input format type as ‘EsInputFormat’ (This format type is defined in elasticsearch-hadoop jar). In org.apache.hadoop.conf.Configuration set elastic search index type using field ‘es.resource’ and any search query using field ‘es.query’ and also set InputFormatClass as ‘EsInputFormat’ as shown below:
ElasticSourceHadoopSinkJob.java
1
2
3
4
5
6
7
8
9
10
11
12
13
14
15
16
17
18
19
20
21
22
23
24
25
26
27
28
29
30
31
32
33
34
import java.io.IOException;
import org.apache.hadoop.conf.Configuration;
import org.apache.hadoop.fs.Path;
import org.apache.hadoop.io.MapWritable;
import org.apache.hadoop.io.Text;
import org.apache.hadoop.mapreduce.Job;
import org.apache.hadoop.mapreduce.lib.output.FileOutputFormat;
import org.apache.hadoop.mapreduce.lib.output.TextOutputFormat;
import org.elasticsearch.hadoop.mr.EsInputFormat;
 
public class ElasticSourceHadoopSinkJob {
 
 public static void main(String arg[]) throws IOException, ClassNotFoundException, InterruptedException{
 
 Configuration conf = new Configuration();
 conf.set("es.resource", "movies/movie");
 //conf.set("es.query", "?q=kill");
 
 final Job job = new Job(conf,
 "Get information from elasticSearch.");
 
 job.setJarByClass(ElasticSourceHadoopSinkJob.class);
 job.setMapperClass(ElasticSourceHadoopSinkMapper.class);
 
 job.setInputFormatClass(EsInputFormat.class);
 job.setOutputFormatClass(TextOutputFormat.class);
 job.setNumReduceTasks(0);
 job.setMapOutputKeyClass(Text.class);
 job.setMapOutputValueClass(MapWritable.class);
 FileOutputFormat.setOutputPath(job, new Path(arg[0]));
 
 System.exit(job.waitForCompletion(true) ? 0 : 1);
 }
}
ElasticSourceHadoopSinkMapper.java
1
2
3
4
5
6
7
8
9
10
11
12
13
14
15
import java.io.IOException;
 
import org.apache.hadoop.io.MapWritable;
import org.apache.hadoop.io.Text;
import org.apache.hadoop.mapreduce.Mapper;
 
public class ElasticSourceHadoopSinkMapper extends Mapper<Object, MapWritable, Text, MapWritable> {
 
 @Override
 protected void map(Object key, MapWritable value,
 Context context)
 throws IOException, InterruptedException {
 context.write(new Text(key.toString()), value);
 }
}

HDFS as source & Elastic Search as sink:

In Map Reduce job, specify the index/index type of search engine from where you need to load data from hdfs file system. And input format type as ‘EsOutputFormat’ (This format type is defined in elasticsearch-hadoop jar). ElasticSinkHadoopSourceJob.java
1
2
3
4
5
6
7
8
9
10
11
12
13
14
15
16
17
18
19
20
21
22
23
24
25
26
27
28
29
30
31
32
33
34
35
import java.io.IOException;
 
import org.apache.hadoop.conf.Configuration;
import org.apache.hadoop.fs.Path;
import org.apache.hadoop.io.MapWritable;
import org.apache.hadoop.io.NullWritable;
import org.apache.hadoop.mapreduce.Job;
import org.apache.hadoop.mapreduce.lib.input.FileInputFormat;
import org.apache.hadoop.mapreduce.lib.input.TextInputFormat;
import org.elasticsearch.hadoop.mr.EsOutputFormat;
 
public class ElasticSinkHadoopSourceJob {
 
public static void main(String str[]) throws IOException, ClassNotFoundException, InterruptedException{
 
 Configuration conf = new Configuration();
 conf.set("es.resource", "movies/movie");
 
 final Job job = new Job(conf,
 "Get information from elasticSearch.");
 
 job.setJarByClass(ElasticSinkHadoopSourceJob.class);
 job.setMapperClass(ElasticSinkHadoopSourceMapper.class);
 
 job.setInputFormatClass(TextInputFormat.class);
 job.setOutputFormatClass(EsOutputFormat.class);
 job.setNumReduceTasks(0);
 job.setMapOutputKeyClass(NullWritable.class);
 job.setMapOutputValueClass(MapWritable.class);
 
 FileInputFormat.setInputPaths(job, new Path("data/ElasticSearchData"));
 
 System.exit(job.waitForCompletion(true) ? 0 : 1);
 }
}
ElasticSinkHadoopSourceMapper.java
1
2
3
4
5
6
7
8
9
10
11
12
13
14
15
16
17
18
19
20
21
22
23
24
25
26
27
28
29
30
31
32
33
import java.io.IOException;
 
import org.apache.hadoop.io.ArrayWritable;
import org.apache.hadoop.io.IntWritable;
import org.apache.hadoop.io.LongWritable;
import org.apache.hadoop.io.MapWritable;
import org.apache.hadoop.io.NullWritable;
import org.apache.hadoop.io.Text;
import org.apache.hadoop.mapreduce.Mapper;
 
public class ElasticSinkHadoopSourceMapper extends Mapper<LongWritable, Text, NullWritable, MapWritable>{
 
 @Override
 protected void map(LongWritable key, Text value,
 Context context)
 throws IOException, InterruptedException {
 
 String[] splitValue=value.toString().split(",");
 MapWritable doc = new MapWritable();
 
 doc.put(new Text("year"), new IntWritable(Integer.parseInt(splitValue[0])));
 doc.put(new Text("title"), new Text(splitValue[1]));
 doc.put(new Text("director"), new Text(splitValue[2]));
 String genres=splitValue[3];
 
 if(genres!=null){
 String[] splitGenres=genres.split("\\$");
 ArrayWritable genresList=new ArrayWritable(splitGenres);
 doc.put(new Text("genres"), genresList);
 }
 context.write(NullWritable.get(), doc);
 }
}

Integrate with Hive:

Download elasticsearch-hadoop.jar file and include it in path using hive.aux.jars.path as shown below: bin/hive –hiveconf hive.aux.jars.path=<path-of-jar>/elasticsearch-hadoop-2.0.0.jar or ADD  elasticsearch-hadoop-2.0.0.jar to <hive-home>/lib and <hadoop-home>/lib

Elastic Search as source & Hive as sink:

Now, create external table  to load data from Elastic search as shown below:
1
CREATE EXTERNAL TABLE movie (id BIGINT, title STRING, director STRING, year BIGINT, genres ARRAY<STRING>) STORED BY 'org.elasticsearch.hadoop.hive.EsStorageHandler' TBLPROPERTIES('es.resource' = 'movies/movie');
You need to specify the elastic search index type using ‘es.resource’ and can specify query using ‘es.query’.
Load data from Elastic Search to Hive

Elastic Search as sink & Hive as source:

Create an internal table in hive like ‘movie_internal’ and load data to it. Then load data from internal table to elastic search as shown below:
  • Create internal  table:
1
CREATE  TABLE movie_internal (title STRING, id BIGINT, director STRING, year BIGINT, genres ARRAY<STRING>) ROW FORMAT DELIMITED FIELDS TERMINATED BY ',' COLLECTION ITEMS TERMINATED BY '$' MAP KEYS TERMINATED BY '#' LINES TERMINATED BY '\n' STORED AS TEXTFILE;
  • Load data to internal table:
1
LOAD DATA LOCAL INPATH '<path>/hiveElastic.txt' OVERWRITE INTO TABLE movie_internal;
hiveElastic.txt
1
2
Title1,1,dire1,2003,Action$Crime$Thriller
Title2,2,dire2,2007,Biography$Crime$Drama
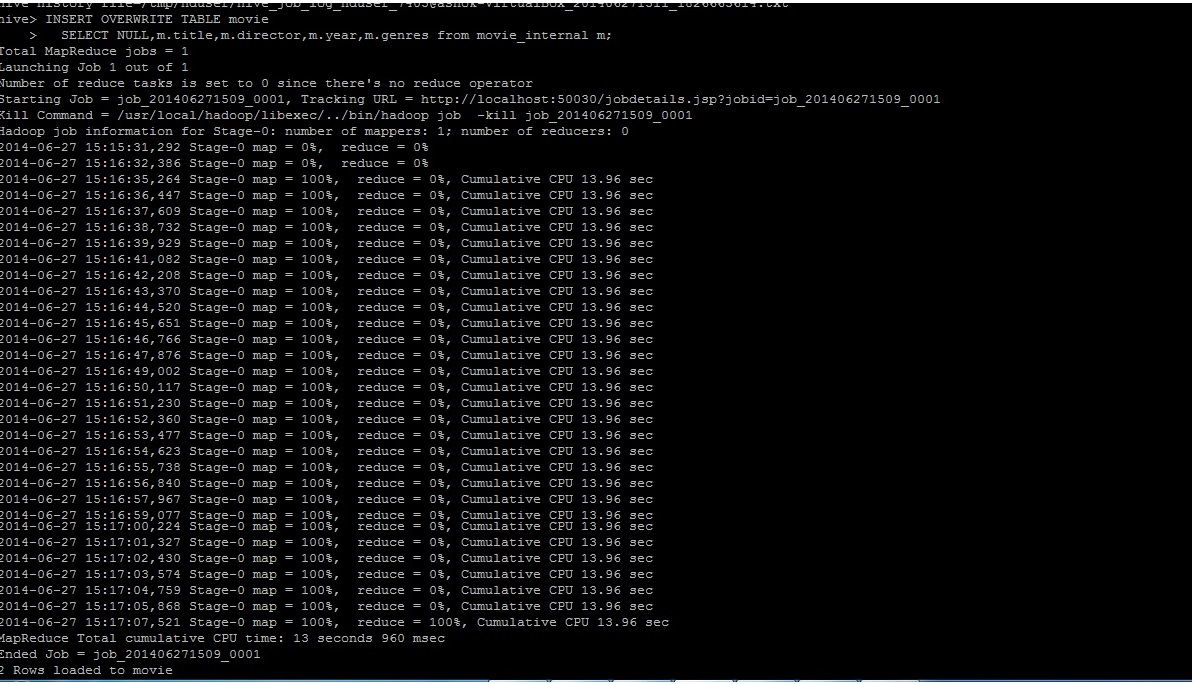
  • Load data from hive internal table to ElasticSearch :
1
INSERT OVERWRITE TABLE movie SELECT NULL, m.title, m.director, m.year, m.genres FROM movie_internal m;

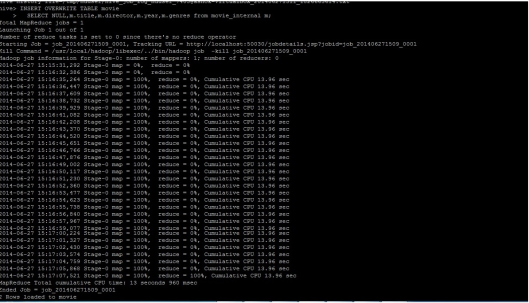
Load data from Hive to Elastic Search
Verify inserted data in Elastic Search query
Verify inserted data from Elastic Search query