we are running Hadoop clusters on different environments using Cloudbreak and apply SLA autoscaling policies on the fly, thus monitoring the cluster is a key operation.
Although various solutions have been created in the software industry for monitoring of activities taking place in a cluster, but it turned out that only a very few of them satisfies most of our needs. When we made the decision about which monitoring libraries and components to integrate in our stack we kept in mind that it needs to be:
- scalable to be able to efficiently monitor small Hadoop clusters which are consisting of only a few nodes and also clusters which containing thousands of nodes
- flexible to be able to provide overview about the health of the whole cluster or about the health of individual nodes or even dive deeper into the internals of Hadoop, e.g. shall be able to visualize how our autoscaling solution for Hadoop YARN called Periscope moves running applications between queues
- extensible to be able to use the gathered and stored data by extensions written by 3rd parties, e.g. a module which processes the stored (metrics) data and does real-time anomaly detection
- zero-configuration to be able to plug into any existing Hadoop cluster without additional configuration, component installation
Based on the requirements above our choice were the followings:
- Logstash for log/metrics enrichment, parsing and transformation
- Elasticsearch for data storage, indexing
- Kibana for data visualization
High Level Architecture
In our monitoring solution one of the design goal was to provide a generic, pluggable and isolated monitoring component to existing Hadoop deployments. We also wanted to make it non-invasive and avoid adding any monitoring related dependency to our Ambari, Hadoop or other Docker images. For that reason we have packaged the monitoring client component into its own Docker image which can be launched alongside with a Hadoop running in another container or even alongside a Hadoop which is not even containerized.
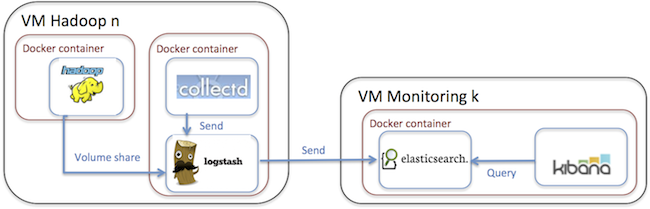
In a nutshell the monitoring solution consist of client and server containers. The contains the Elasticsearch and the Kibana module. The server container is horizontally scalable and it can be clustered trough the clustering capabilities of Elasticsearch.
The container – which is deployed on the machine what is needed to be monitored – contains the Logstash and the collectd module. The Logstash connects to Elasticsearch cluster as client and stores the processed and transformed metrics data there.
Hadoop metrics
The metrics data what we are collecting and visualizing are provided by Hadoop metrics, which is a collection of runtime information that are exposed by all Hadoop daemons. We have configured the Metrics subsystem in that way that it writes the valuable metrics information into the filesystem.
In order to be able to access the metrics data from the monitoring client component – which is running inside a different Docker container – we used the capability of Docker Volumes which basically let’s you access a directory within one container form other container or even access directories from host systems.
For example if you would like mount the from the container named under the in the monitoring client container then the following sequence of commands needs to be executed:
Hundreds of different metrics are gathered form Hadoop metrics subsystem and all data is transformed by Logstash to JSON and stored in ElasticSearch to make it ready for querying or displaying it with Kibana.
The screenshot below has been created from one of our sample dashboard which is displaying Hadoop metrics for a small cluster which was started on my notebook. In this cluster the Yarn’s Capacity Scheduler is used and for demonstration purposes I have created a queue called alongside the queue. I have reduced the capacity of the queue to 30 and defined the queue with a capacity of 70. The red line in the screenshot belongs to the queue, the yellow line belongs to the queue and the green line is the queue which is the common ancestor both of them. In the benchmark, the jobs were submitted to the queue and a bit later (somewhere around 17:48) the same jobs were submitted to the queue. As it is clearly observable for queue the allocated Containers, Memory and VCores were higher and jobs were finished much more faster than those that were submitted to the default queue.
Such kind of dashboard is extremely useful when we are visualizing decisions made by Periscope and check e.g. how the applications are moved across queues, or additional nodes are added or removed dynamically from the cluster.
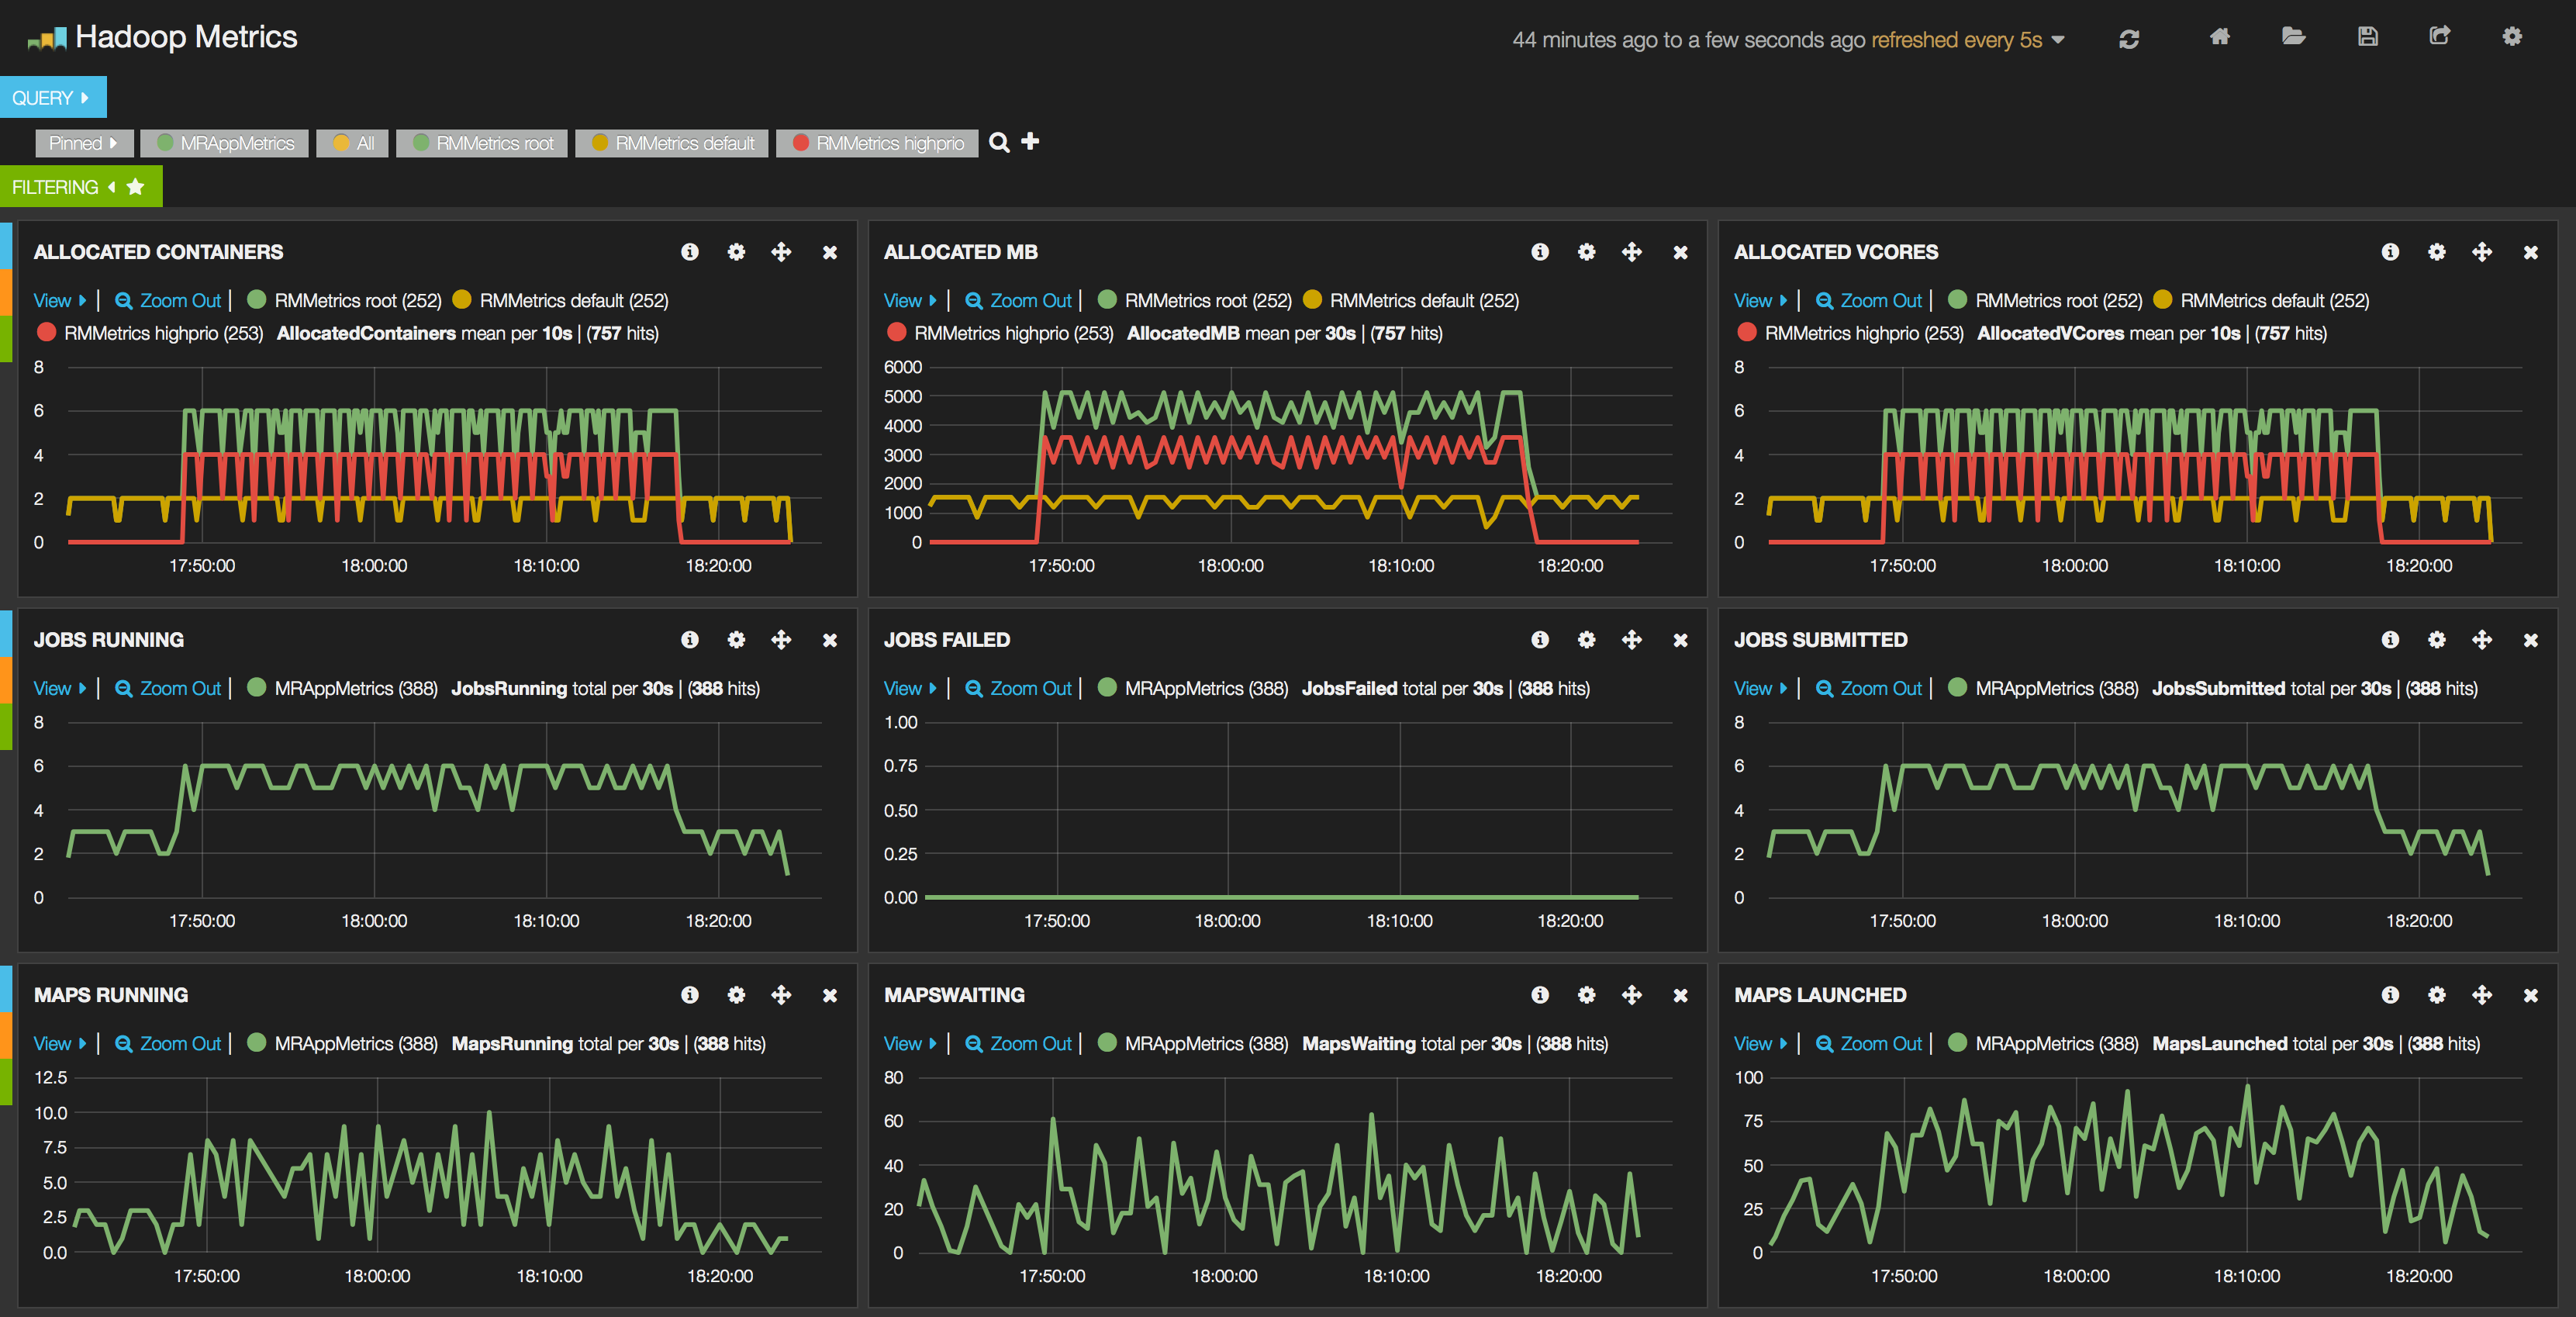
To see it in large, please click here.
Since all of the Hadoop metrics are stored in the Elasticsearch, therefore there are a lot of possibilities to create different dashboards using that particular parameter of the cluster which is interesting for the operator. The dashboards can be configured on the fly and the metrics are displayed in real-time.
System resources
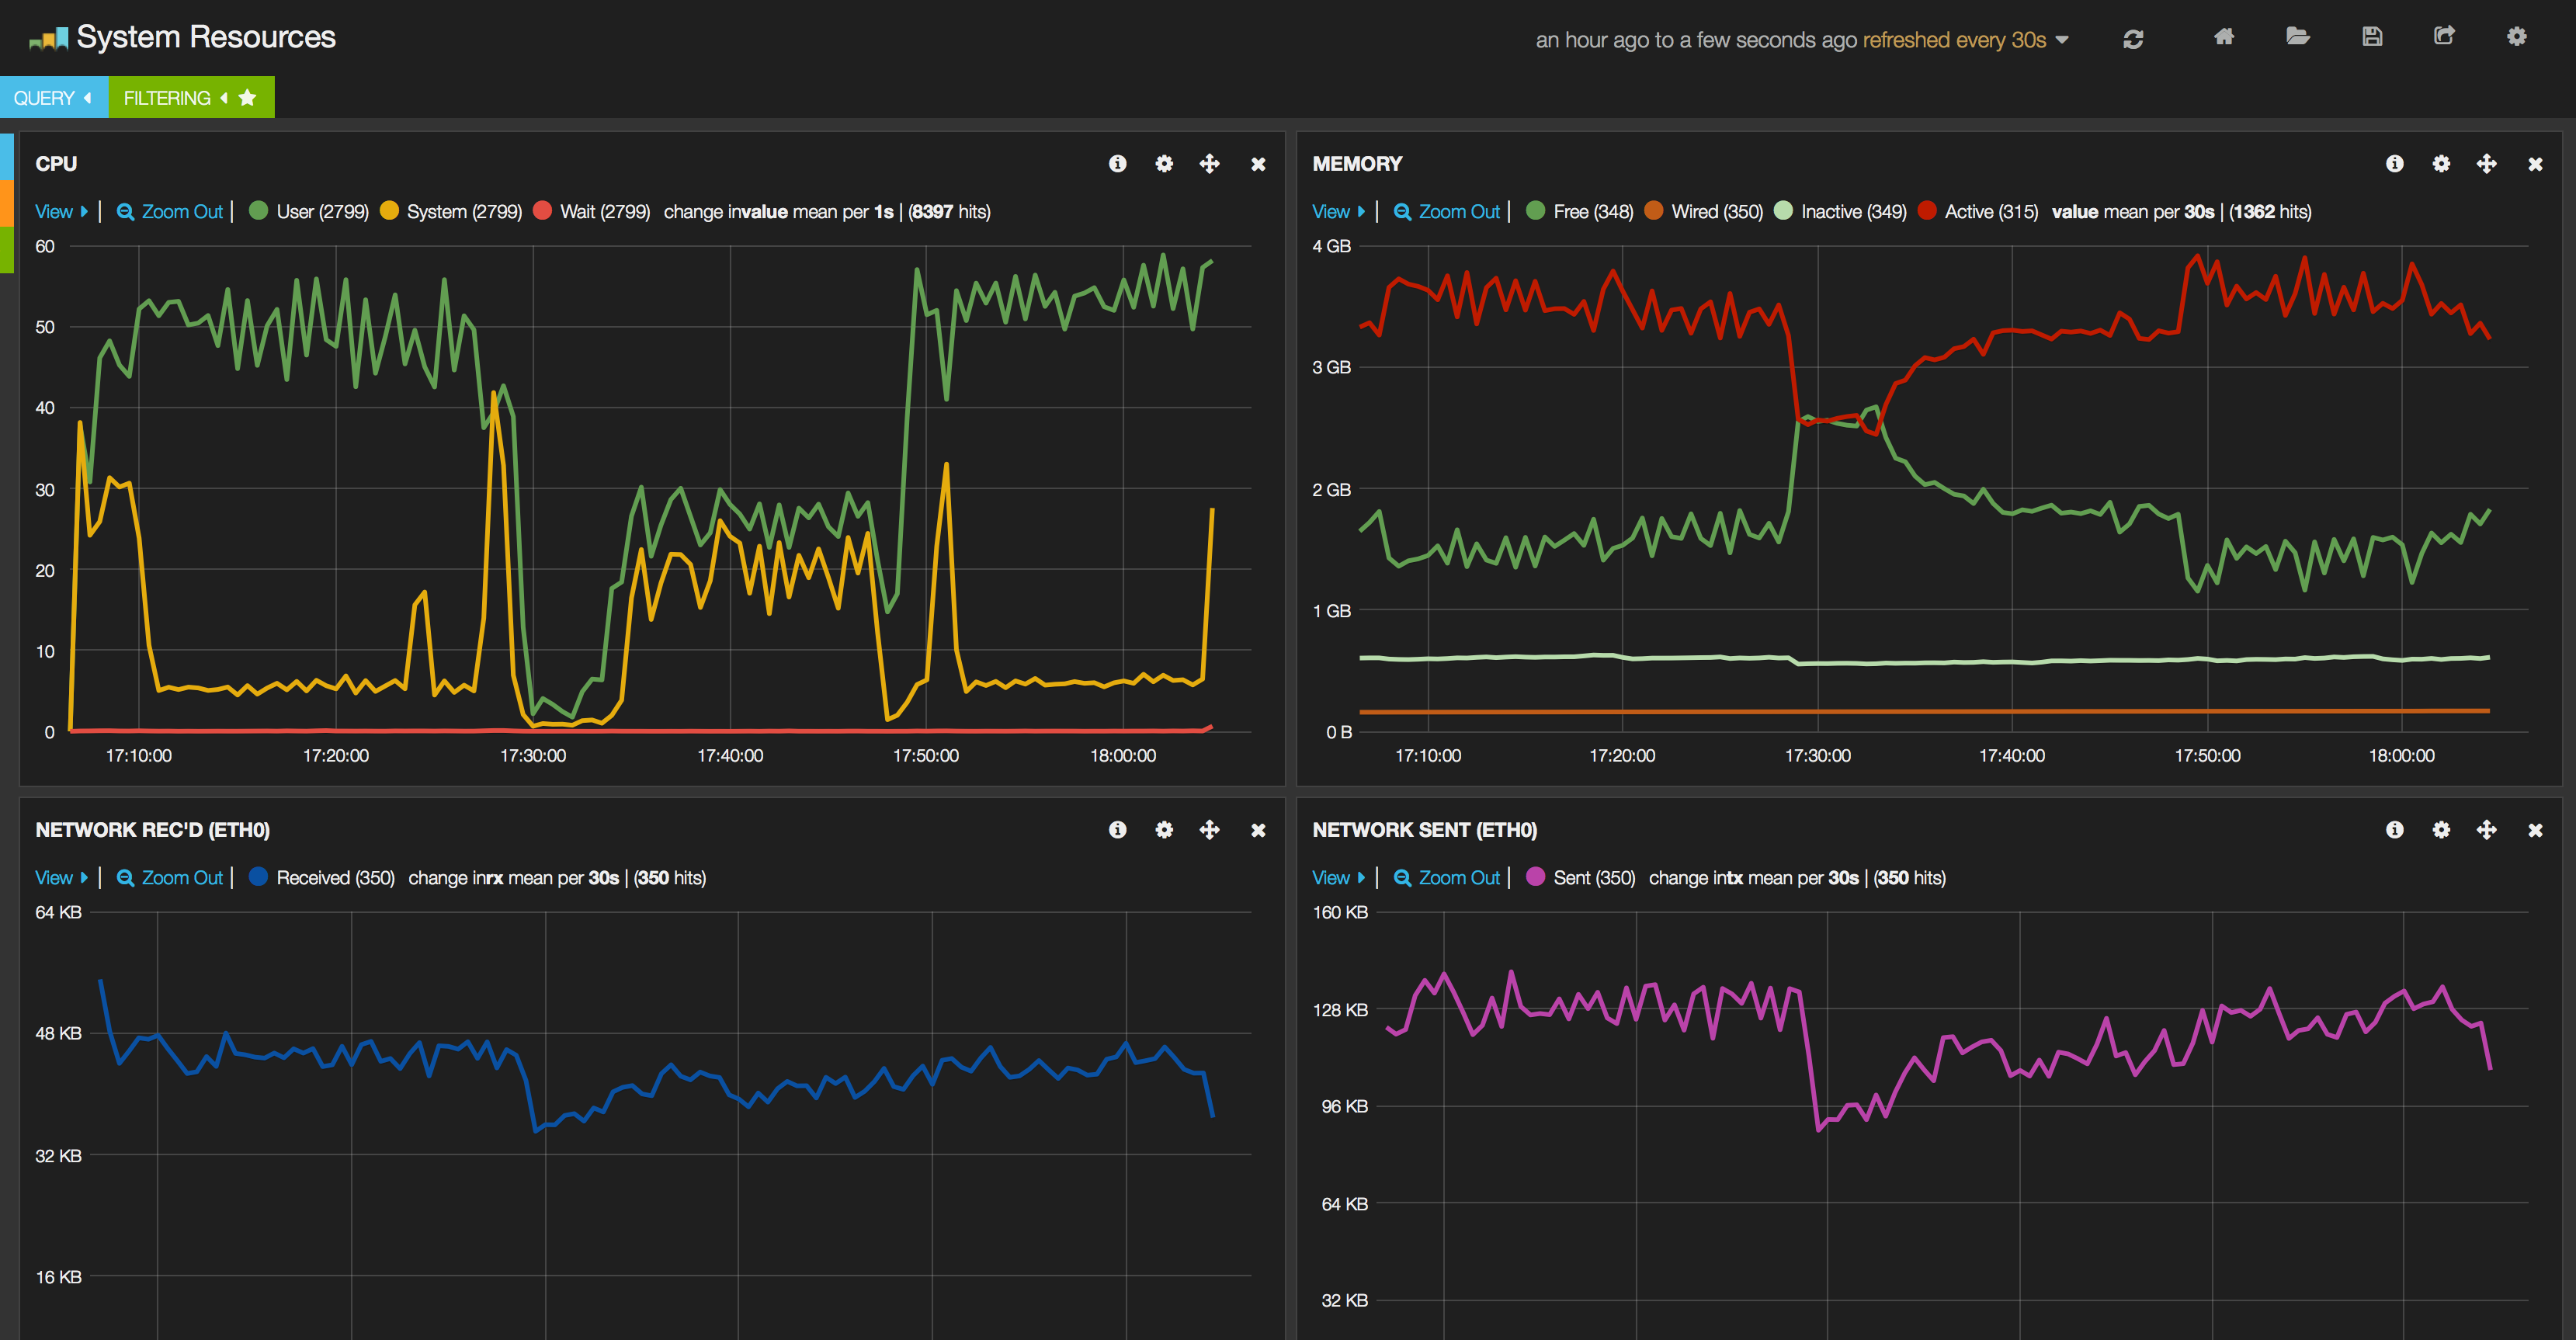
Beside Hadoop metrics, “traditional” system resource data (cpu, memory, io, network) are gathered with the aid of collectd. This can also run inside the monitoring client container since due to the resource management in Docker the containers can access and gather information about the whole system and a container can even “steal” the network of other container if you start with: which is very useful if cases when network traffic is monitored.
Summary
So far the Hadoop metrics and system resource metrics have been processed, but it is planned to use the information written into the history file (or fetch from History server) and make it also trough Elasticsearch to be able to provide information about what is happening inside the jobs.
No comments:
Post a Comment